I first calculated the odds of drawing in 1999. At that time and for several years afterwards, the summary reports were only available in paper form. To get the data into a computer, I had to scan those paper documents. There were all kinds of issues related to scanning, my scanner couldn’t tell the difference between an 8 and a B. To have any chance at a decent prediction, I had to find and “fix” all of the issues with the data. It was necessary to create program that would looks at all the numbers, add things in various ways, calculate whatever it could to determine if the data was good. This is called “parity checking” and my program does a lot of it.
For 2023, the deer hunt 158 Chesnimus triggered an error. If you look at the report, you can see that 440 tags were authorized but over 600 drew. What’s interesting is that this particular hunt triggered a parity error last year (2022) as well. That makes me think that there’s a valid reason for the numbers. If you happen to know why 158 exhibites this behavior, where the drawn tag count greatly exceeds the authorized tag count, please send me a note as I’m interested. Perhaps it is something that the predictions need to consider.
—
The summary report for many hunts list zero for the number of applicants that drew with zero points when there were applicants that drew in the 75% pool with zero points.
Here is an example screen shot:
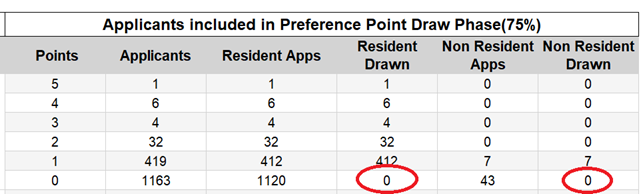
The values listed in the red circle indicates no residents or non-residents drew in the 75% pool and this is incorrect. By using other data on this hunts summary, data in the earlier columns, you can calculate the correct number. My prediction program corrects this when generating the predictions. The reason that I am mentioning this issue is that for folks that like to look at the summary report and make their own predictions, this zero can trip you up. This could cause you to conclude that no one with zero points drew in the 75% pool draw, resulting in a bad prediction and a bad hunt choice decision for the coming year.