What’s the difference?
Every source of Oregon controlled odds that I am aware of, like the on-line pay to view websites, all use what I call “previous odds”. These websites look at the ODFW summary report from the past year and calculate what the odds of drawing were. Then they post last years draw odds as their prediction for the coming year. I post last years actual odds on this website. However, using last years odds as a prediction for this year can lead to disappointment!
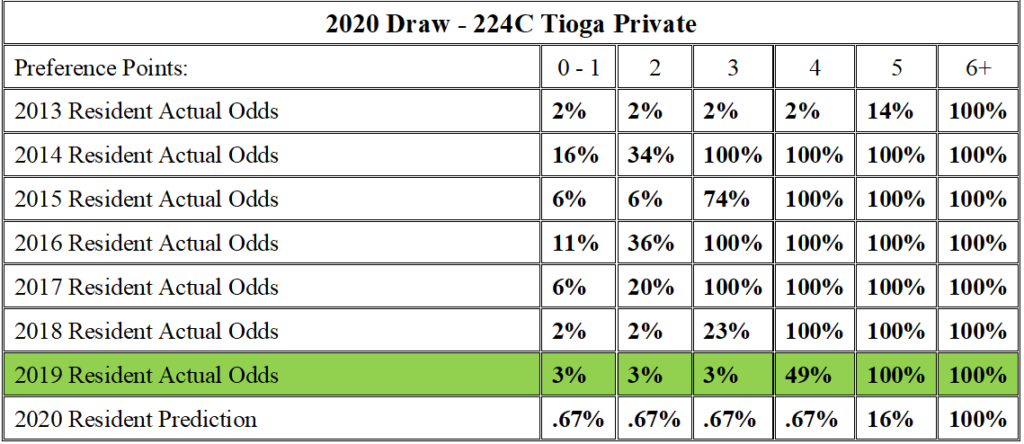
Here is an example, let’s say you have 4 or 5 preference points and the odds for your hunt looks like this:

This looks like a pretty good choice for someone with 5 points. For someone willing to take a little risk, the 4 point level isn’t bad either, basically its 50/50. If you applied with 4 points and didn’t draw, you assume you were in the unlucky 50 percent. If you applied with 5 points and didn’t draw, it’s a conspiracy.
The truth is, previous odds like this example here are often not even close. While these odds list 100% with 5 points, that was last year. The odds with 5 points for this year is actually 16%. With 5 points you you have a 1 in 8 chance. At the four point level, the odds are not 49%, 50/50, like it was last year. The odds for this year are 0.67, less than 1%. Your odds of drawing with 4 points is 1 in 150. It turns out that these numbers are from a real hunt, 224C Tioga Private and these are real 2020 draw numbers. I have never applied for this hunt and know nothing about it, but it makes for a good example.
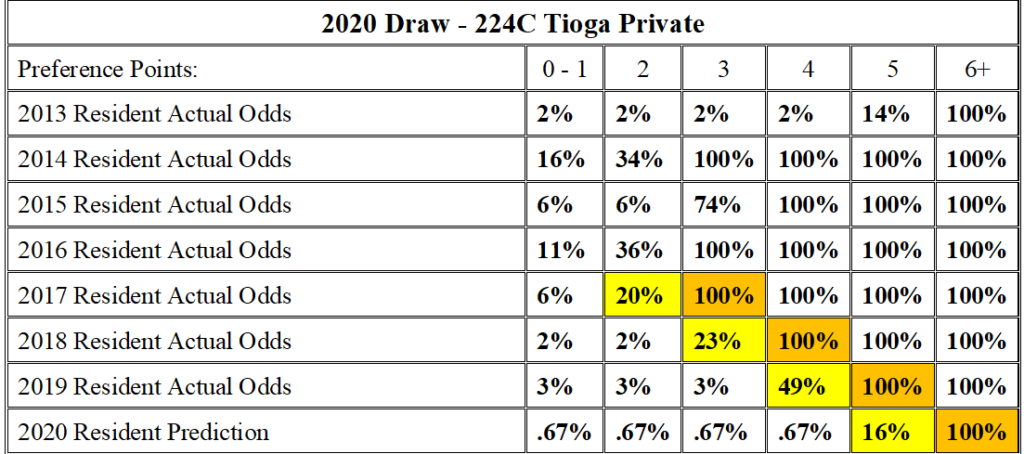
Below is what the hunt actually looked like. I want to point out a couple of things. First, the green row below is the information that you are paying for on these pay to view websites. It’s the actual odds of drawing last year. It’s easy to calculate, so I list it. In fact, I list all of the past results for every hunt (if the hunt existed) – in this example I am listing what the actual draw results were for 224c from 2013 through 2019:
Listing several years of past results makes it easy to see the trend. In the table below, the yellow cells are the first point level where the odds become 100%. The yellow cells are the break point or the point level where 75% tags run out. For this hunt, you can see that the point level needed for 100% odds goes up by one each year – indicated by the darker yellow shading:
Don’t base your application decision on just last year’s odds, there is a good chance that you will be making a bad decision.
Predictive Odds
In the example above, I’ve tried to point out that using previous odds will lead to incorrect application decisions. Predictive odds differ from previous in that they identify a trend. By carrying the trend forward, a prediction is made as to what will happen next.
Looking at multiple years of historical results for a hunt, such as 224C above, we can see the clear trend. However, there is another point I need to make: making an application decision based just on a perceived trend from historical results can also lead to a bad decision.
I picked 224C for a reason and there are two additional aspects of 224C that need to be considered. The table below is a portion of my details page for hunt 224C – I list a details table for every hunt. Compare the values in the yellow cells. Notice that from 2017 to 2019 applicants were leaving this hunt (the number of applicants is clearly getting smaller). The blue, purple and green cells indicate the same thing. They show that applicants that many applicants that applied in 2017 chose not to apply in 2018. The behavior continued from 2018 to 2019. Applicants that didn’t draw chose to not apply the following year. This behavior is summarized in the trend line by the red and dark yellow boxes. The trend line indicates how the applicant population is changing, at each point level. The dark yellow boxes all have positive numbers, this is indicating that applicants are jumping into this hunt at the higher end – high end fall in. The red boxes indicate that there is a large exodus of applicants at the lower end – low end fall out.
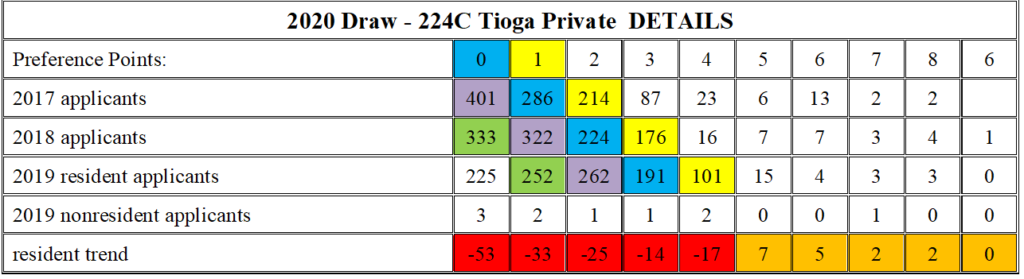
There are far more applicants leaving this hunt than are jumping into it which begs the question: if there are fewer applicants each year, why are the odds getting harder and not easier? The prediction I’ve created clearly shows that this hunt is going to get one point harder to draw next year. How can this possibly occur given there will be fewer applicants this year?
The answer to this is another important point that I want to make.
The ODFW cut the tags for 224C from 100 tags to 25. Previous odds do not consider changes to the tag count for the up coming year, but it is a critical factor.
This particular hunt had two factors impacting the odds, an exodus of applicants and a big change to the number of tags. Either one of these factors invalidate previous odds. The interesting aspect of this hunt, for 2020 these two factors pulled in opposition directions and cancelled each other out.
On this website, you’ll find the previous odds. You’ll also find the predictive odds. I also list the application numbers and the tags. If you want to perform your own analysis, and I encourage this, consider these factors. Use my data (it’s free), look over the summary report, become knowledgeable and make the best hunt choices decisions that can be made.